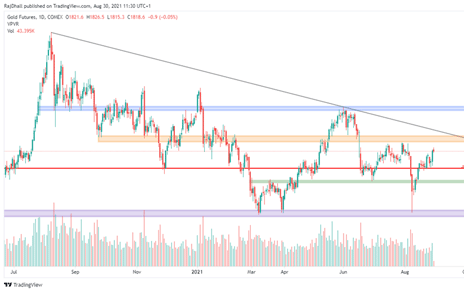
If the price is to move beyond that level, there is lots of traffic currently in the way.
More near term, the red horizontal line represents the volume point of control and this is where the most contracts have been traded within the timeframe on the chart.
