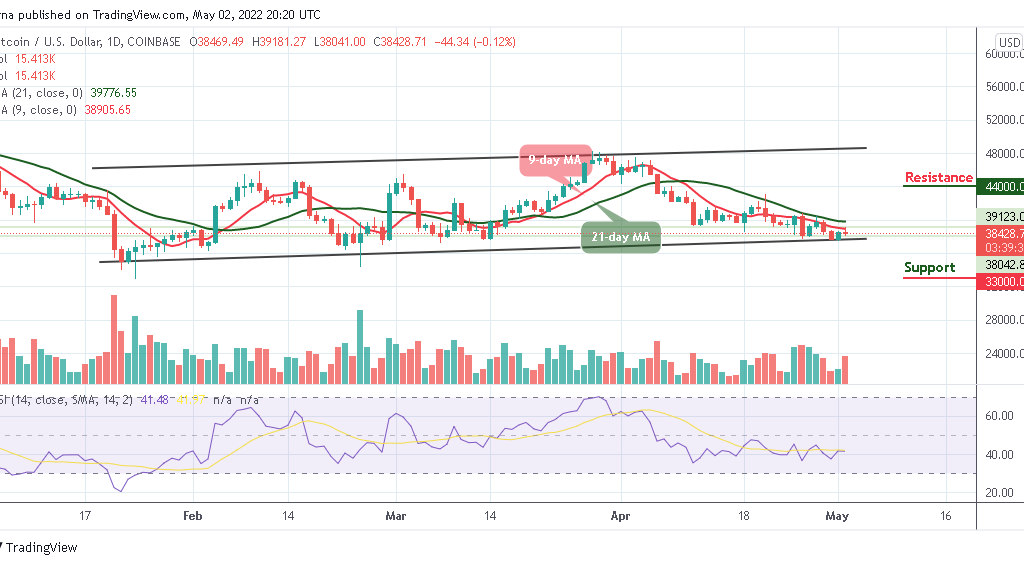
At the moment the Bitcoin price may continue to follow the sideways movement, but the daily chart shows that the formation of a bearish movement is likely to play out.
As the Bitcoin price remains below the 9-day and 21-day moving averages, BTC/USD is likely to cross below the lower boundary of the channel as the technical indicator Relative Strength Index moves in the same direction below the 50-level.
Meanwhile, a sustainable move above the 9-day and 21-day moving averages may locate the resistance level of $40,000, which may allow for an extended recovery towards the potential resistance levels at $44,000, $46,000, and $48,000.
However, if the price breaks above the 9-day moving average and crosses above the upper boundary of the channel, higher resistance would be located at $39,000 but on the contrary, the technical indicator Relative Strength Index is seen facing the south.
Moreover, if the bearish movement steps back, the support level of $38,000 may not be able to hold the selling pressure.
